Methane has a potent ability to warm the atmosphere, and addressing methane pollution has become one of the most rapidly developing plotlines in climate science. Now, satellites and aircraft have become key tools to spot methane super-polluters like oil and gas operations, landfills and coal mines – which is an important step in slowing down pollution.
Why methane matters to the climate

Many people know that carbon dioxide is the largest contributor to climate change. But methane matters, too, because of how effectively it traps heat in the atmosphere – like an extra-thick down duvet. In its first 20 years in the atmosphere, methane has about 80 times the warming impact compared to carbon dioxide.
The short-acting but powerful effect of methane makes cleaning it up a prime target for slowing climate warming as quickly as possible. But so far, it’s been hard to unravel exactly how much methane is being emitted, and from where.
Scientists know that methane can bubble up from diffuse sources like cow burps or flooded rice fields. Or it can pour into the atmosphere from oil and gas operations. Sometimes it leaks from defective equipment; sometimes it’s released intentionally. Some methane releases go unreported, and some emissions estimates appear to be significantly undercounted.
No matter the source, as the amount of methane in the atmosphere climbs ever higher, the race to pinpoint these pollution sources is accelerating.
How eyes in the sky can help
Satellite and aircraft observations are now revealing the myriad locations where methane pollution is occurring. Measurements from above show how oil and gas extraction, landfills, coal mines and large-scale livestock agriculture operations are causing substantial amounts of methane pollution.
Riley Duren is the CEO of Carbon Mapper, one of several organizations using satellites to measure climate-warming greenhouse gases such as methane.
“Our current focus at Carbon Mapper is on methane monitoring of super-emitters, because that’s the biggest potential for immediate emission reductions,” Duren said.
He explained that as methane-measuring satellites proliferate, they’re helping to bring our fuzzy understanding of methane emissions into sharper focus.
The quickest bang-for-buck to slow climate-warming pollution would be to pinpoint the large emitters and work toward cleaning them up. These large-scale, point-source emissions account for about 40% of total methane emissions from human activities.
The Carbon Mapper data portal combines observations from five different instruments, and one of the most powerful aspects of this data is that it doesn’t rely on corporate or government reporting. Anyone can see the results for themselves.
Read on for the breakdown of some of the largest methane polluters observed in the U.S. These results are based on methane plumes measured by the five instruments within the Carbon Mapper data portal as of Oct. 16. These findings aren’t a comprehensive accounting of all methane emissions in the U.S., but they’re a snapshot of some of the largest and most persistent sources of methane pollution measured so far.
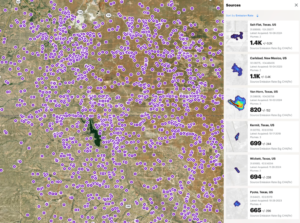
See for yourself
See the current data for methane emissions in the Carbon Mapper data portal. The data in this view will update automatically.
Tip: Sort by emission rate to see the largest methane plumes.
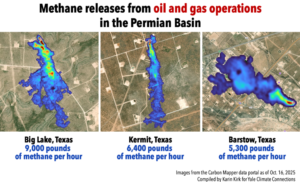
1. Oil and gas industry, especially in Texas and New Mexico
- 4,800 individual sources of large methane emissions from the U.S. oil and gas industry have been measured and mapped to date
- 1.2 million pounds of methane released per hour in the U.S.
The Permian Basin is a region of thick sedimentary rocks in western Texas and southeastern New Mexico. It’s the largest source of crude oil in the U.S., as well as a major producer of natural gas, which is primarily composed of methane.
Satellite images show thousands of plumes of methane billowing from numerous types of infrastructure: wells, pipelines, compressor stations and gas processing facilities.
Sharon Wilson and Justin Mikulka work for a small nonprofit named Oilfield Witness that documents methane released from oil and gas infrastructure.
“The Permian is a methane disaster,” Mikulka said.
Many of these methane plumes are not leaks: “Those are intentional releases to protect the equipment and maintain operation,” Wilson said.
One example is flaring, which is when methane is burned intentionally. A methane flare looks dramatic because it makes a large flame. But burning methane is better for the climate than releasing it directly to the atmosphere, because burning methane converts it to the less potent carbon dioxide.
One problem with flaring, Wilson explained, is that the flares often malfunction. Sometimes they burn inefficiently, releasing a mixture of methane and carbon dioxide. Even worse, the pilot light on the flares can go out, and then methane is not burned at all – it just vents directly to the atmosphere.
“I have tracked flares being unlit for well over a year,” she said.
In theory, flaring is supposed to be used infrequently. But Oilfield Witness analyzed the applications used by oil and gas companies as they requested permission to burn or vent methane in Texas. State regulators approved these applications over 99% of the time. A collaborative story between Inside Climate News and ProPublica paints the picture behind these massive methane emissions in Texas.
Satellite data can shine a light on the large and frequent releases of methane from oil and gas operations. In some situations, Duren and the Carbon Mapper team reach out to oil and gas operators when they find large methane plumes.
“We have seen a number of cases – over 150 to date – where operators do take steps to close leaks when notified,” he said.
But Wilson and Mikulka aren’t optimistic.
“The industry has the tools to track what they’re doing in real time, and yet nothing changes,” Mikulka said.
“There’s just absolutely no evidence that the U.S. oil and gas industry can produce oil and gas without huge methane emissions,” Wilson said.
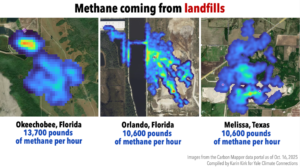
2. Landfills
- 336 individual super-emitter landfills have been detected to date
- 500,000 pounds of methane emitted per hour
Landfills produce many of the largest plumes of methane measured by Carbon Mapper in the U.S.
Methane releases from oil and gas extraction are numerous, but they’re often short-lived or intermittent. By contrast, landfills tend to give off methane over months or years, which adds up to a substantial amount of methane pollution.
Given the large scale of methane coming from landfills, it’s all the more important to have accurate measurements. In general, reporting methods currently used by the EPA are not in agreement with data coming from aircraft and satellites. Several recent studies using aircraft and satellite measurements have found considerably larger emissions than the estimates from the EPA’s Greenhouse Gas Reporting Program.
Landfill operators can use fairly simple measures to slow methane emissions, such as capturing and collecting the gas or using impermeable covers. Organic materials like food waste release large amounts of methane, and municipalities can divert food waste from landfills by using composting programs. As is often the case with cutting pollution, the economic benefits of implementing these actions are greater than the costs.
As of this writing, the U.S. landfills with the largest methane emissions based on Carbon Mapper observations are in Okeechobee, Florida; Orlando, Florida; and Melissa, Texas.
3. Coal mines
- 192 super-emitter mines have been detected to date
- 220,000 pounds of methane emitted per hour
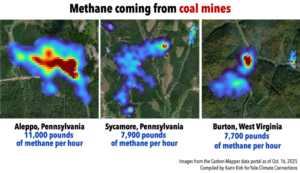
Methane coming from coal mines (Karin Kirk/Yale Climate Connections)
Coal formed when vegetation was buried in an oxygen-poor environment, compressed and heated for millions of years. This same process also produced natural gas – which, again, is composed primarily of methane. The natural gas collects in coal seams and in the fractures and pores of the surrounding rock.
Underground mines are the largest source of concentrated methane emissions. In some cases, methane floats up from ventilation shafts, which are necessary to protect workers. Both active and abandoned coal mines can emit methane. Some methane emissions from coal mines can be captured, particularly where methane is coming from ventilation systems.
Individual mines can be the cause of disproportionately high amounts of methane pollution. For example, the Hail Creek mine in Queensland, Australia, accounts for 20% of all methane coming from coal mines in Australia, while producing only 1% of the country’s coal.
Worldwide, methane from coal mines is often underreported. In Australia, for example, data from the Copernicus Sentinel-5 Precursor satellite showed coal mines are emitting at least 40% more methane than previous estimates.
In the U.S., Carbon Mapper found the largest concentration of super-emitting coal mines in southwestern Pennsylvania and north-central West Virginia. The mines with the highest rates of methane emissions measured so far by Carbon Mapper are in Aleppo, Pennsylvania; Sycamore, Pennsylvania; and Burton, West Virginia.
4. Livestock
- 317 super-emitter livestock operations have been detected to date
- 47,000 pounds of methane emitted per hour
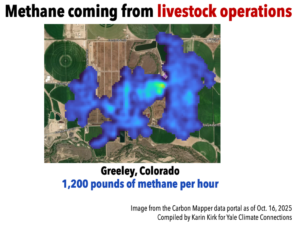
Methane coming from livestock operations (Karin Kirk/Yale Climate Connections)
Livestock like cows and sheep produce methane as part of their digestive process. In most cases, methane emissions from livestock are too low in concentration to be detected by aerial measurements. These numerous but small sources of methane have a large impact on the atmosphere, especially when you consider the thousands of farms across the country. Nevertheless, satellites and aircraft can only spot the largest polluters, and they don’t see smaller, diffuse methane emissions that come from many farms.
Feedlots, large dairy farms and animal processing facilities concentrate enough animals and their waste into small enough areas that their methane pollution can be detected with overhead measurements. These large methane plumes in the Carbon Mapper database are just a subset of the overall emissions from the livestock industry.
In the U.S., one of the most persistent sources of methane from livestock in the Carbon Mapper database so far is in Greeley, Colorado, which appears to be a cattle feedlot. Instruments have flown over this site more than 20 times, with methane detected 96% of the time, with maximum emissions measured at over 4,400 pounds per hour.
Is there methane in your neighborhood?
The next article in this series will offer instructions, tips and resources for how to track methane, carbon pollution and other airborne pollutants near you. Climate pollution is a global problem, but it happens on local scales. Stay tuned for more insights.
This article first appeared on Yale Climate Connections and is republished here under a Creative Commons Attribution-NonCommercial-NoDerivatives 4.0 International License. Banner photo: Aerial view of a landfill in Florida (iStock image).
Sign up for The Invading Sea newsletter by visiting here. To support The Invading Sea, click here to make a donation. If you are interested in submitting an opinion piece to The Invading Sea, email Editor Nathan Crabbe. To learn more about how cows and other livestock contribute to methane pollution, watch the video below.
